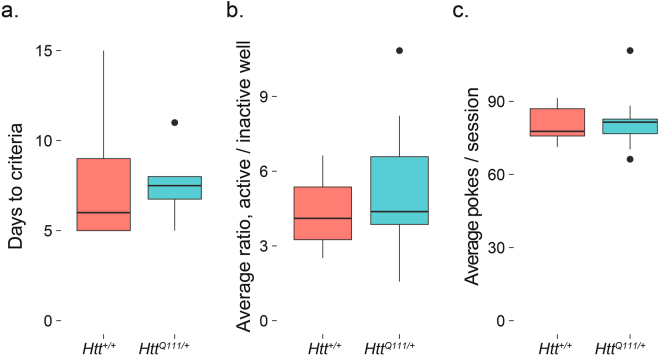
Figure 3.
Normal performance of FR1 task in 10-month-old male HttQ111/+ mice. No genotype effect is observed in the days to criteria (a). t(7.1) = 0.2, p = 0.8), active/inactive well ratio (b). t(16.9) = −0.9, p = 0.4) or average total nose pokes per session (c). t(16.5) = −0.1, p = 0.9). Horizontal lines in the boxes indicate 25th, 50th and 75th percentiles, while vertical lines indicate 1.5 times the interquartile range; outliers beyond these values are graphed as points.

