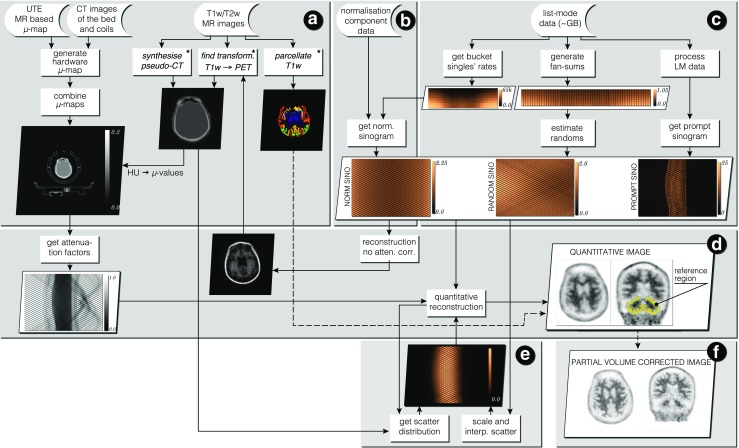
Fig. 1.

Infrastructure for standalone PET image reconstruction and analysis of PET/MR brain data using amyloid PET tracer. Section A presents the image input data with necessary processing for generating accurate hardware and object μ-maps as well as parcellation of the brain image into standard anatomical regions (used in reconstruction and analysis sections D and F). In section B the normalisation component data is used to generate single factors for each sinogram bin, with the use of bucket singles—the output from list-mode (LM) processing in section C. Apart from singles’ buckets, the LM processing in section C generates prompt and delayeds sinograms, and fan sums, which are used for estimating low noise randoms in each sinogram bin. In stage D image reconstruction and analysis takes place with a heavy use of forward and back projectors. Note that the attenuation factors are generated with the forward projector. Section E contains scatter estimation which is coupled with image reconstruction—the scatter is updated every time a better image estimation of the radiotracer distribution is available. Using the parcellation from A and the system’s point spread function (PSF), the reconstructed image is corrected for the partial volume effect in section F. ∗ External software packages
