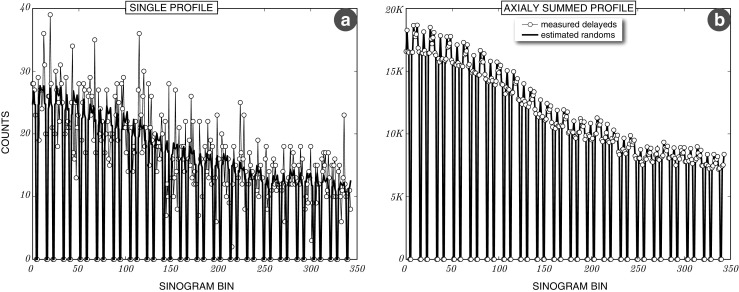
Fig. 12.

Sinogram profiles of estimated randoms and measured delayed events. a: Single sinogram profile for the measured delayeds and estimated random events of a 10 minute brain amyloid scan. b: The same profile but with all sinograms summed axially to obtain better statistics and demonstrate a good agreement of the measured delayeds and the estimated random events
