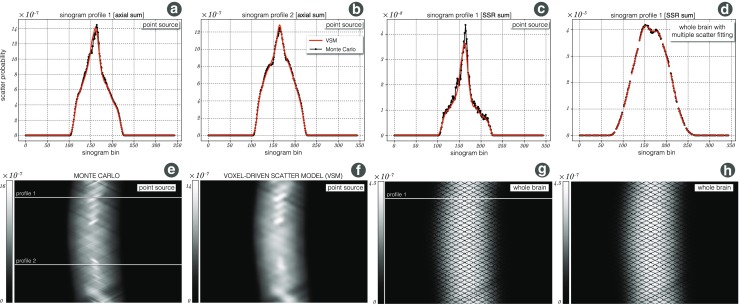
Fig. 13.

Scatter validation using Monte Carlo (MC) SimSET simulations: a Single scatter response to a point source E (see Fig. 5b) as estimated through the proposed VSM model (red) and the MC (dotted black) for sinogram profile 1 as marked in (e); the sinograms were summed axially for good MC statistics. b The same as (a) but for sinogram profile 2. c The same sinogram profile 1 as in (a) but the sinograms are single-slice rebinned (SSR). d Scaling of VSM estimate to multiple scatter MC sinogram for SSR sinogram profile 1. e The sum of all MC simulated single scatter sinograms with marked profiles 1 and 2 for reference; f the corresponding VSM estimated scatter sinogram. g An SSR sinogram of the full brain MC simulation with marked profile 1 for reference; h the corresponding full brain VSM estimated scatter sinogram (SSR summed)
