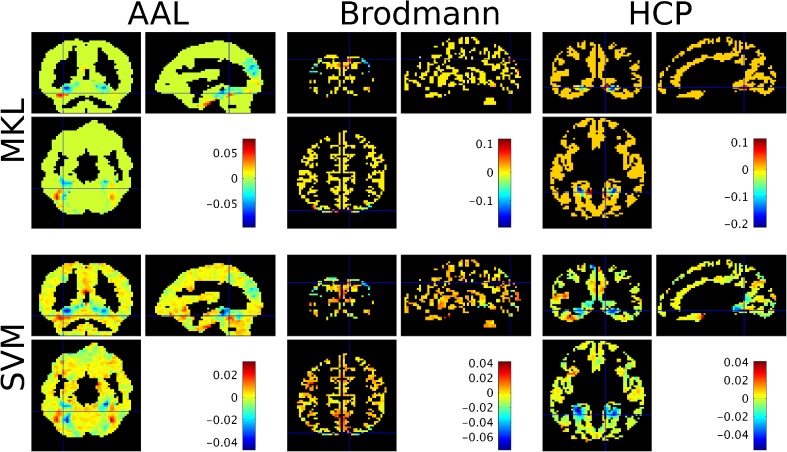
Fig. 4.
Weight images at the voxel level for the ‘faces’ versus ‘houses’ comparison based on the Haxby dataset (average across folds), for each model considered. For the MKL models (top row), voxels in green (AAL), yellow (Brodmann) or orange (HCP) have a null contribution to the model. For each atlas, the cross-hair was positioned on the region with the highest MKL model contribution across folds (i.e. dm)

