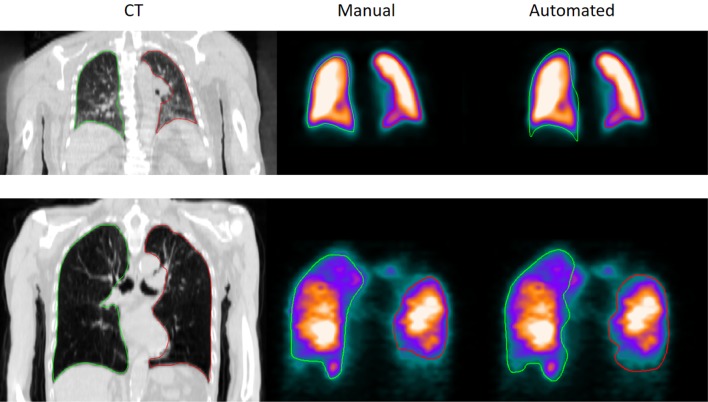
Fig. 3.
CT image, manual and automatic segmentation of two patients. Top row shows a slice from a patient with normal ventilation/perfusion and the bottom row shows a slice from a patient with peripheral loss of both ventilation and perfusion. The left column shows CT images, the middle column shows manual segmentations, and the right column shows automatic segmentations. Green delineation colour = left lung, red delineation colour = right lung

