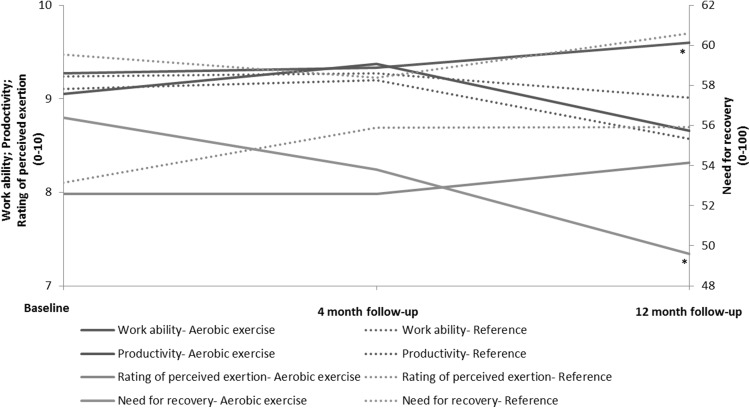
Fig. 3.
Development in the work ability, productivity, rating of exertion, and need for recovery during the intervention period. Work ability, productivity, and rating of exertion are presented on a scale from 0 to 10 (primary vertical axis). Need for recovery is presented on a scale from 0-100 (secondary vertical axis). *p < 0.05 significant change between baseline and 12 month follow-up in the aerobic exercise group compared to the reference group

