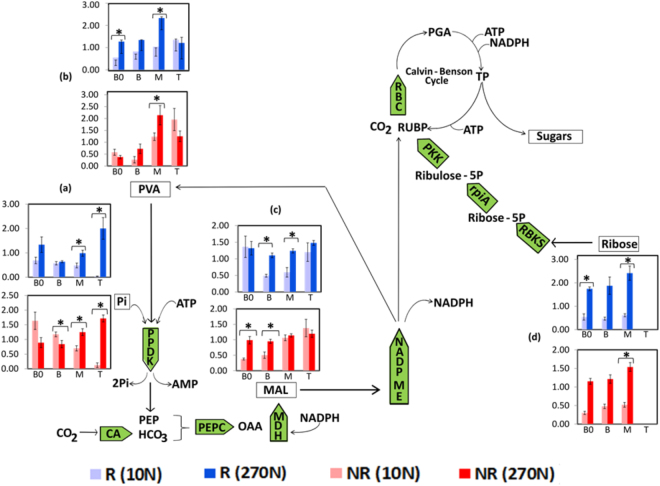
Figure 8.
Scheme of the sugarcane photosynthetic pathway showing the quantification of phosphate (a), pyruvate (b), malate (c) and ribose (d) along the sugarcane leaf blade. ATP, adenosine triphosphate; CA, carbonic anhydrase; MDH, malate dehydrogenase; NADPH, nicotinamide adenine dinucleotide phosphate, NADP ME, NADP malic enzyme; OAA, oxaloacetate; PEP, phosphoenolpyruvate; PEPC, PEP carboxylase; PGA, phosphoglycerate; PKK, ribulose-5-phosphate kinase; PPDK, pyruvate Pi-dikinase; RBC, Rubisco; RUBP, Ribulose-1,5-bisphosphate; TP, triose phosphates; RBKS, ribokinase; rpiA, ribose 5-phosphate isomerase. R corresponds to the responsive genotype, and NR refers to the nonresponsive genotype. B0, Base “zero”; B, Base; M, Middle; T, Tip. Note: The ratio of metabolite abundance is represented by relative concentration in log2 scale. Data are presented as the mean ± SE with five replications. (*) indicates values determined by the Student’s t-test to be significantly.

