Fig. 2.
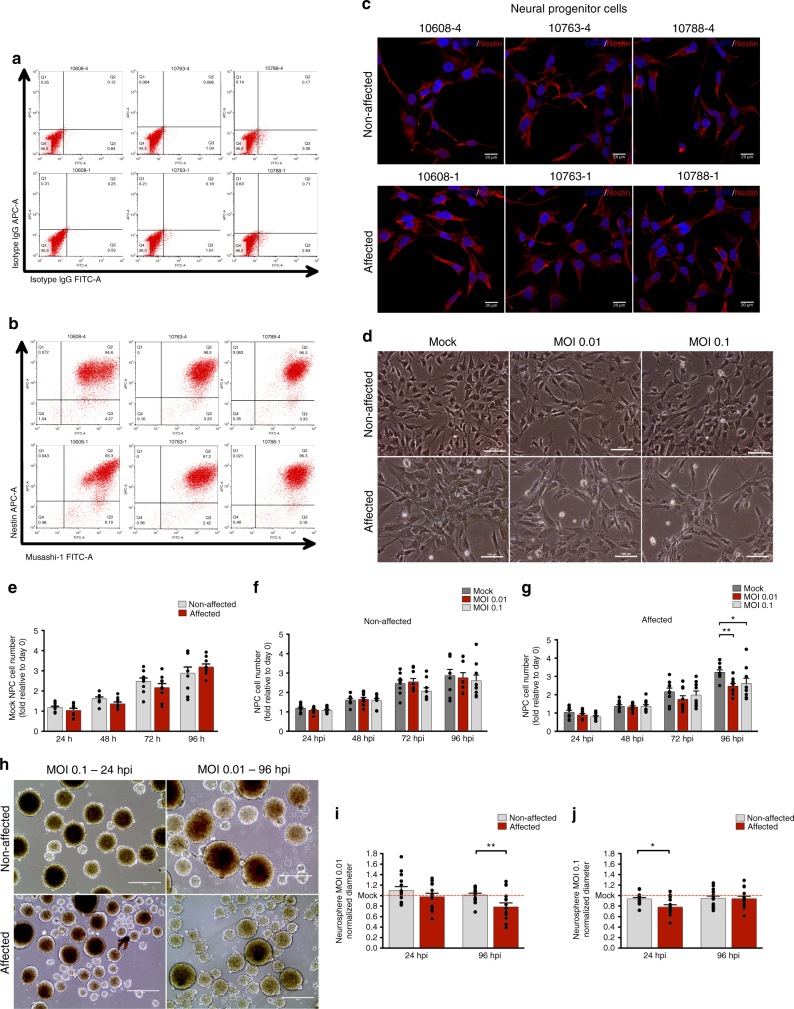
NPC characterization and ZIKVBR infection in DZ-D cells (see also Supplementary Fig. 1). a, b NPCs were stained with isotype IgG APC-A and isotype IgG FITC-A (a) and Nestin APC-A and Musashi-1 FITC-A (b) and were analyzed by flow cytometry to confirm (or show) population homogeneity for neural progenitor markers. c Nestin staining by immunofluorescence. Scale bar (SB), 20 μm d Representative phase-contrast micrograph of infected NPCs (#10608 twins). SB, 100 μm. e Analysis of cell number of Mock-infected NPCs from non-affected and CZS-affected twins (n = 3 technical replicates; mean ± SEM). f, g MOI 0.01 and 0.1 infected NPCs from non-affected (#10608-4, #10763-4, and #10788-4) (f) and CZS-affected (#10608-1, #10763-1, and #10788-1) (g) twins in monolayer cultures at 24, 48, 72, and 96 hpi (n = 3 technical replicates; mean ± SEM; *p < 0.05, **p < 0.01; two-way ANOVA with Bonferroni post hoc analysis). h Representative images of neurospheres infected with ZIKVBR (#10608 twins, n = 2 technical replicates). SB, 400 μm. i, j Normalized diameter of neurospheres at 24 and 96 hpi with MOI 0.01 (i) or MOI 0.1 (j); #10608, #10763 and #10788 twins; n ≅ 15 technical replicates; mean ± SEM; *p < 0.05, **p < 0.01 Student’s t test

