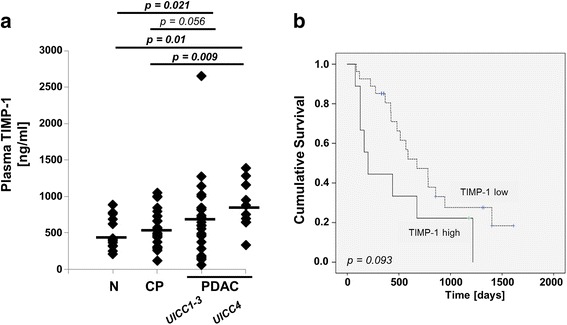
Fig. 1.

a Dot plots for plasma levels of TIMP-1 protein analyzed by ELISA in healthy individuals (control, n = 13), CP patients (n = 25), PDAC patients (UICC 1–3 (n = 26), and UICC 4 (n = 10)). Shapiro-Wilks testing in combination with visual inspection of the histograms showed that samples were not normally distributed. Groups were compared using nonparametric Mann-Whitney U test for independent variables. b Relation of plasma TIMP-1 to Kaplan Meier Overall Survival (OS) curves in PDAC patients. The optimal cut-off value of plasma TIMP-1 levels at 842 ng/ml was determined by maximally selected log-rank statistics. To consider multiple test issues within these analyses, the R-function maxstat.test was employed. For the cut-off at 842 ng/ml the Kaplan Meier curves were generated. Median OS for patients with low plasma TIMP-1 levels (n = 26): 453 days [440–768] 95% CI. Median OS for patients with high plasma TIMP-1 levels (n = 9): 202 days [117–817] 95% CI
