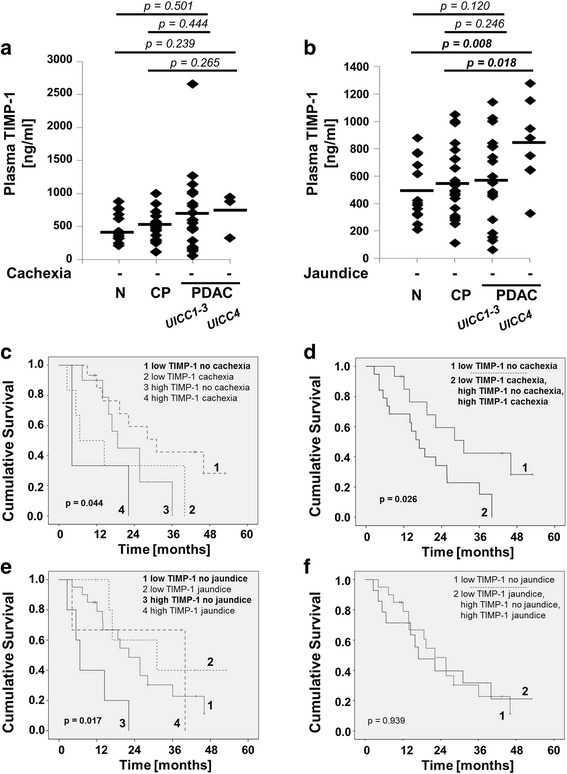
Fig. 4.

a Analysis of TIMP-1 in healthy individuals (control, n = 13), in CP (n = 19), PDAC patients UICC 1–3 (n = 20), and PDAC patients UICC 4 (n = 3) (patients with cachexia were excluded). Shapiro-Wilks testing in combination with visual inspection of the histograms showed that samples were not normally distributed. Groups were compared using nonparametric Mann-Whitney U test for independent variables. b Analysis of TIMP-1 in patients without tumor and acute inflammatory disease (control, n = 13), in CP (n = 24), PDAC patients UICC 1–3 (n = 18), and PDAC patients UICC 4 (n = 8) (patients with jaundice were excluded). Shapiro-Wilks testing in combination with visual inspection of the histograms showed that samples were normally distributed. Groups were compared using Student’s t-test for independent samples. c-f Relation of plasma TIMP-1 and PDAC-associated cachexia (c, d) and jaundice (e, f) to Kaplan Meier Overall Survival (OS) curves in PDAC patients. For the optimal cut-off at 842 ng/ml (see Fig. 1b) and presence or absence of cachexia and jaundice the Kaplan Meier curves were generated. Differences were analyzed by the Log-rank (Mantel-cox) test. c p = 0.112 low TIMP-1 no cachexia vs. low TIMP-1 cachexia; p = 0.097 low TIMP-1 no cachexia vs. high TIMP-1 no cachexia; p = 0.014 low TIMP-1 no cachexia vs. high TIMP-1 cachexia; p = 0.978 low TIMP-1 cachexia vs. high TIMP-1 no cachexia; p = 0.095 low TIMP-1 cachexia vs. high TIMP-1 cachexia; p = 0.402 high TIMP-1 no cachexia vs. high TIMP-1 cachexia. e p = 0.322 low TIMP-1 no jaundice vs. low TIMP-1 jaundice; p = 0.010 low TIMP-1 no jaundice vs. high TIMP-1 no jaundice; p = 0.670 low TIMP-1 no jaundice vs. high TIMP-1 jaundice; p = 0.014 low TIMP-1 jaundice vs. high TIMP-1 no jaundice; p = 0.766 low TIMP-1 jaundice vs. high TIMP-1 jaundice; p = 0.152 high TIMP-1 no jaundice vs. high TIMP-1 jaundice
