
Fig. 1.
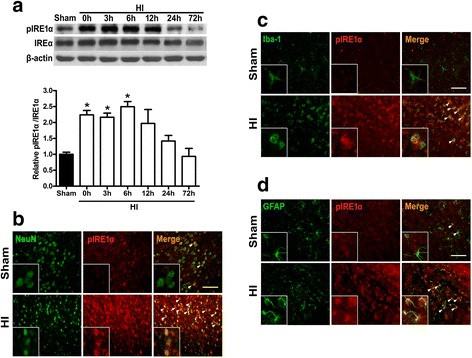
Time course expression of pIRE1α in brain tissues and Immunofluorescence staining showing co-localization post HI. a Western blot assay for temporal profile of pIRE1α and IRE1α expressions from ipsilateral hemisphere at 0, 3, 6, 12, 24, and 72 h post HI; data are expressed as mean ± SEM, n = 5 per group, per time point. Relative densities have been normalized against the sham group. *P < 0.05 compared with sham group. b–d Representative microphotographs of immunofluorescence staining for pIRE1α (red) co-localization on neurons (NeuN, green; b), microglia (Iba-1, green; c), and astrocytes (GFAP, green; d) at 6 h post HI. n = 3 per group, scale bar = 100 μm