Fig. 10.

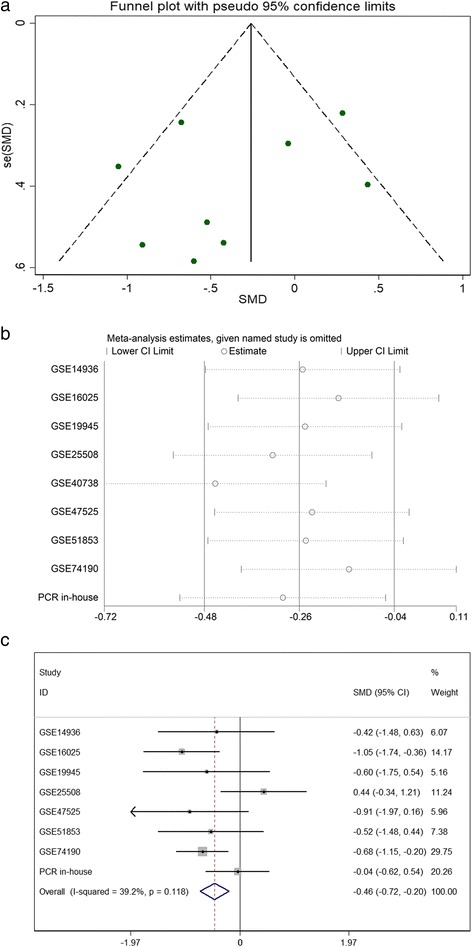
Continuous variable meta-analysis based on GEO datasets and in-house RT-qPCR results. a Funnel plot. b Sensitivity analysis. c Forest plot after the elimination of GSE40738

Continuous variable meta-analysis based on GEO datasets and in-house RT-qPCR results. a Funnel plot. b Sensitivity analysis. c Forest plot after the elimination of GSE40738