
Fig. 9.
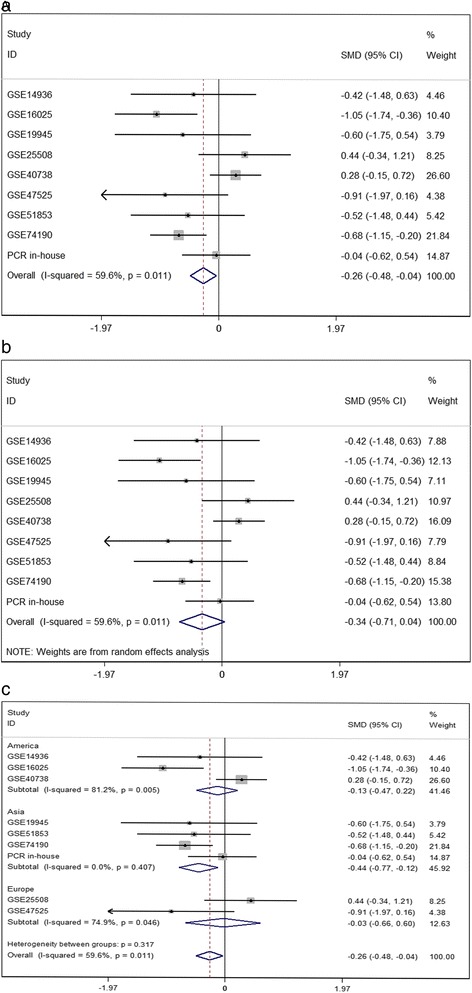
Continuous variable meta-analysis based on GEO datasets and in-house RT-qPCR results. a: Forest plot based on fixed effect model, (b): forest plot based on random effect model, (c): subgroup analysis by region
Official websites use .gov
A
.gov website belongs to an official
government organization in the United States.
Secure .gov websites use HTTPS
A lock (
) or https:// means you've safely
connected to the .gov website. Share sensitive
information only on official, secure websites.
Continuous variable meta-analysis based on GEO datasets and in-house RT-qPCR results. a: Forest plot based on fixed effect model, (b): forest plot based on random effect model, (c): subgroup analysis by region