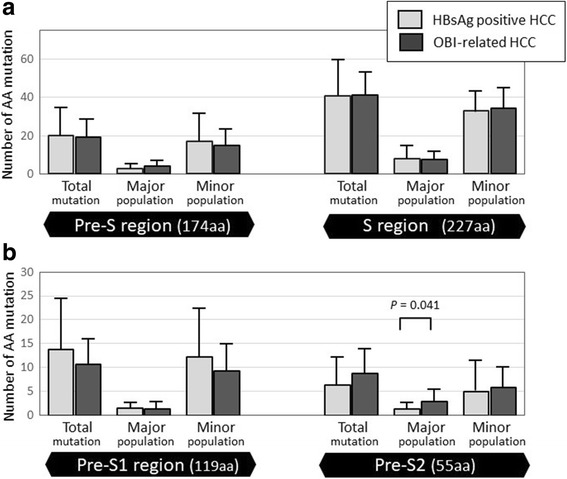
Fig. 1.

Number of aa mutations in the pre-S/S region. Number of aa mutations in the pre-S/S region (a), and mutations were also shown in pre-S1 and pre-S2 region (b). No significant difference in the average number of aa mutations was detected between HBsAg-positive and OBI-related HCC. The proportion of the major variant populations based on the pre-S2 region was significantly higher in OBI-related HCC than in HBsAg-positive HCC
