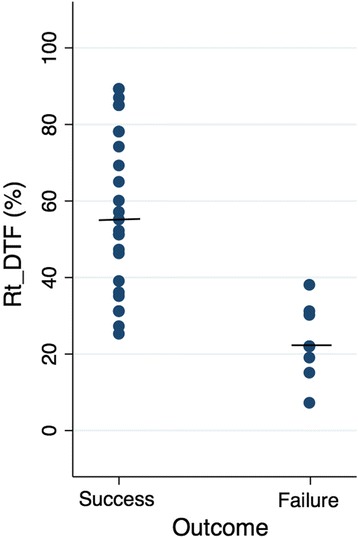
Fig. 2.

Dot plot of the right diaphragm thickening fraction in weaning success and failure groups (success group 57.7 ± 21.2%, failure group 22.9 ± 9.2%, p < 0.001)

Dot plot of the right diaphragm thickening fraction in weaning success and failure groups (success group 57.7 ± 21.2%, failure group 22.9 ± 9.2%, p < 0.001)