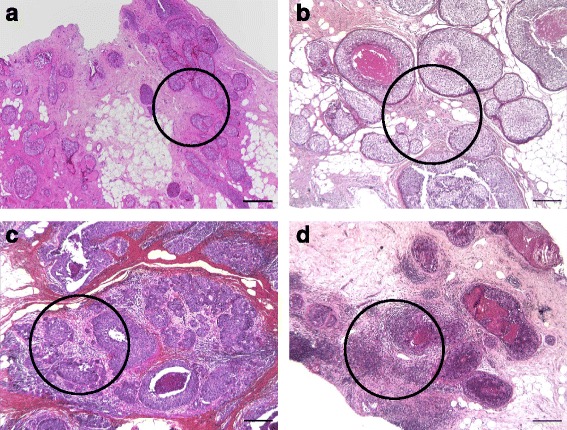
Fig. 1.

Examples of TIL density grades. a) a case representing TIL density grade 0 (TILs are estimated to occupy 2% of the stromal area). H&E, original magnification 4×, scale bar 250 μm; b) a case representing TIL density grade 1 (TILs are estimated to occupy 20% of the stromal area). H&E, original magnification 5×, scale bar 200 μm; c) a case representing TIL density grade 2 (TILs are estimated to occupy 40% of the stromal area). H&E, original magnification 5×, scale bar 200 μm; d) a case representing TIL density grade 3 (TILs are estimated to occupy 60% of the stromal area). H&E, original magnification 5×, scale bar 200 μm. The circles show the areas sampled for tissue microarray construction
