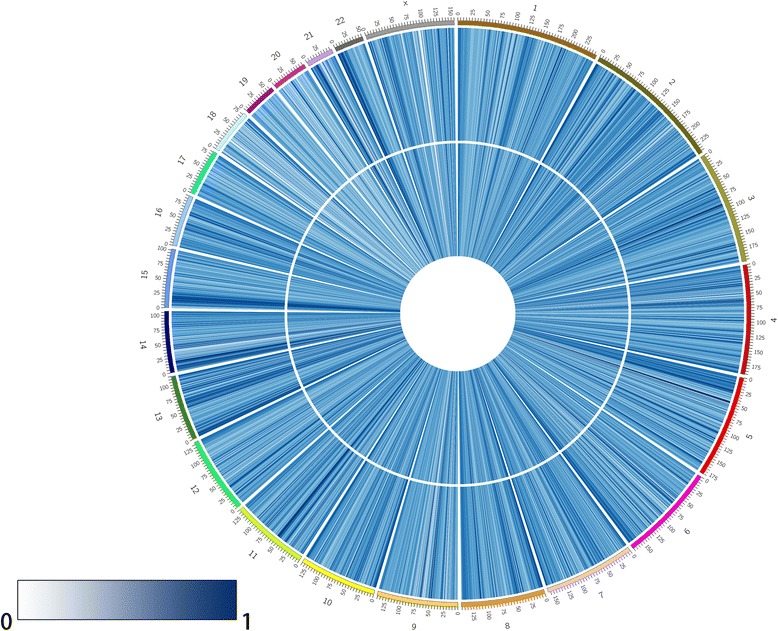
Fig. 1.

Overview of the average genome-wide DNA methylation level of genomic loci at each chromosome in Hainan centenarians and healthy controls, analyzed by Circos software. The inner and outer tracks represent the average methylation level for centenarians and healthy controls, respectively. All chromosomes are presented as 10Mbp-wide windows. The average methylation level in each region is represented as the average β-value (0–1) for all of the probes in that region
