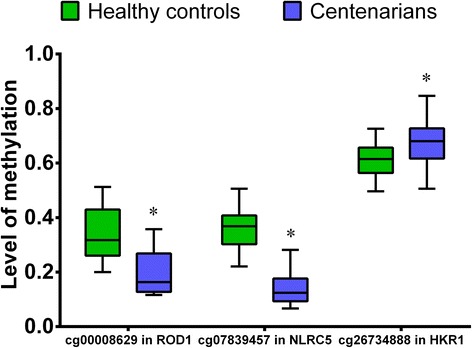
Fig. 3.

The level of methylation at the indicated CpG sites in centenarians (blue boxes) and healthy controls (green boxes). The boxes represent the 25th to the 75th centiles, and solid lines represent the median value for each sample. Error bars represent 95% confidence intervals. * p < 0.05 indicated the significant different between healthy controls and centenarians
