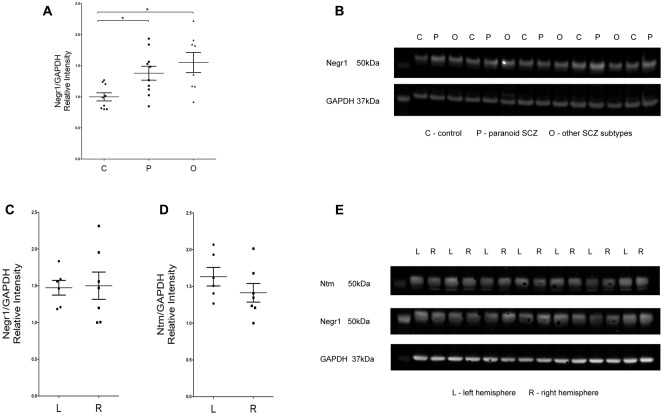
FIGURE 4.
(A,B) Analysis of NEGR1 and representative immunoblots. DLPFC samples were collected from healthy (C, n = 9), paranoid SCZ (P, n = 10) and other SCZ subtype (O, n = 8) patients. (C–E) Analysis of NEGR1 and NTM in the left (L, n = 7) and right hemispheres (R, n = 7), and representative immunoblots. DLPFC samples were collected from healthy patients. Values are means ± SEM. ∗p < 0.05 vs. control.

