Figure 5.
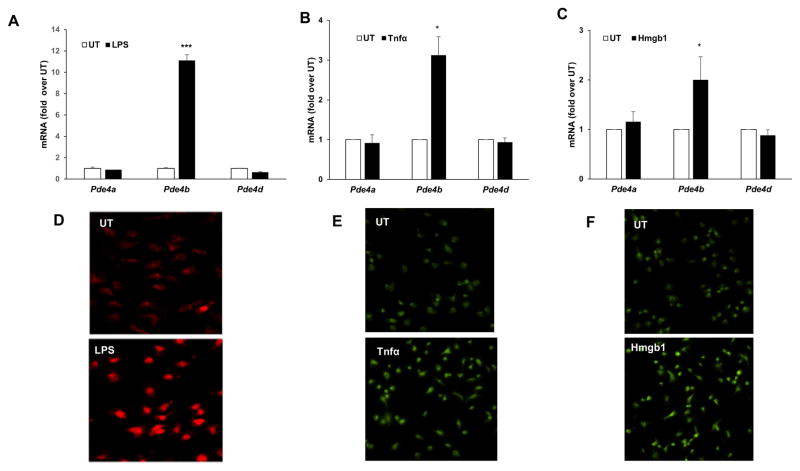
Increase of Pde4b expression in primary microglial cells in response to LPS, Tnfα and Hmgb1. mRNA levels of Pde4a, b and d were quantified by real time qPCR in A, cells treated with LPS, 100 ng/ml for 90 minutes. B, cells treated with recombinant Tnfα, 20 ng/ml for 90 minutes. C, cells treated with recombinant Hmgb1, 10 μg/ml for 90 minutes. Data are presented as mean ± SD from 3 independent experiments, *P<0.05, and *** P<0.001 compared UT. Representative images of IHC for Pde4b protein in D, cells treated with LPS, 100 ng/ml for 3 hours, E, in cells treated with Tnfα, 20 ng/ml for 3 hours, F, in cells treated with Hmgb1, 10 μg/ml for 3 hours.

