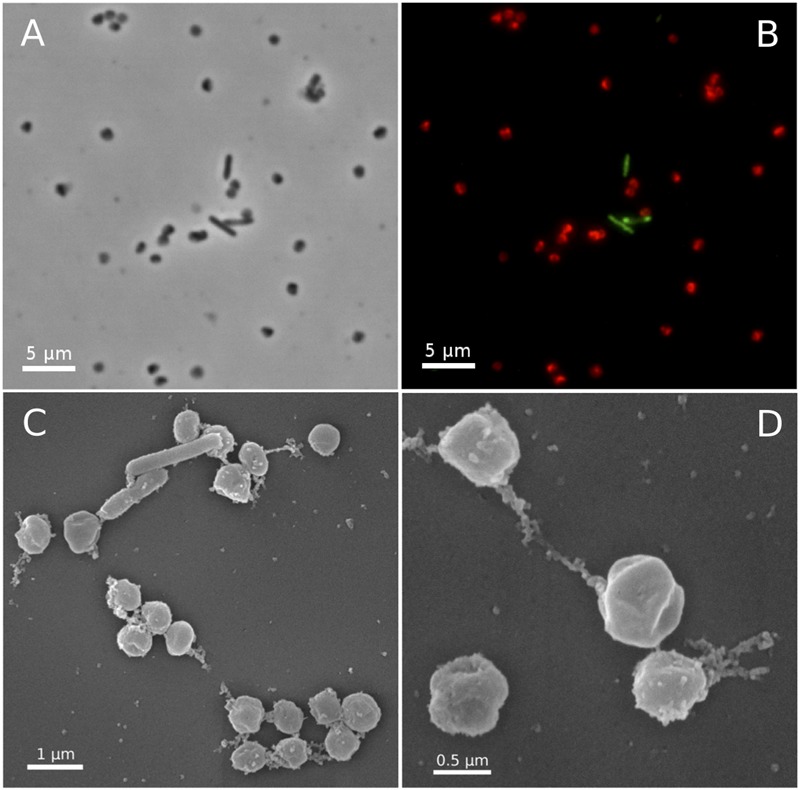
FIGURE 3.

Micrographs of Ca. N. cavascurensis. Light (A) and epifluorescence micrographs (B) of a late exponential enrichment culture analyzed with FISH. Ca. N. cavascurensis cells (red) and bacterial cells (green) were labeled with ARCH 915 and EUB 338 probes respectively, to give a representative picture of the enrichment state. Scanning electron micrographs (C,D) show the spherical nature of Ca. N. cavascurensis cells, having a diameter of 0.6 – 0.8 μm, small rods are visible that belong to the remaining bacterial consortium.
