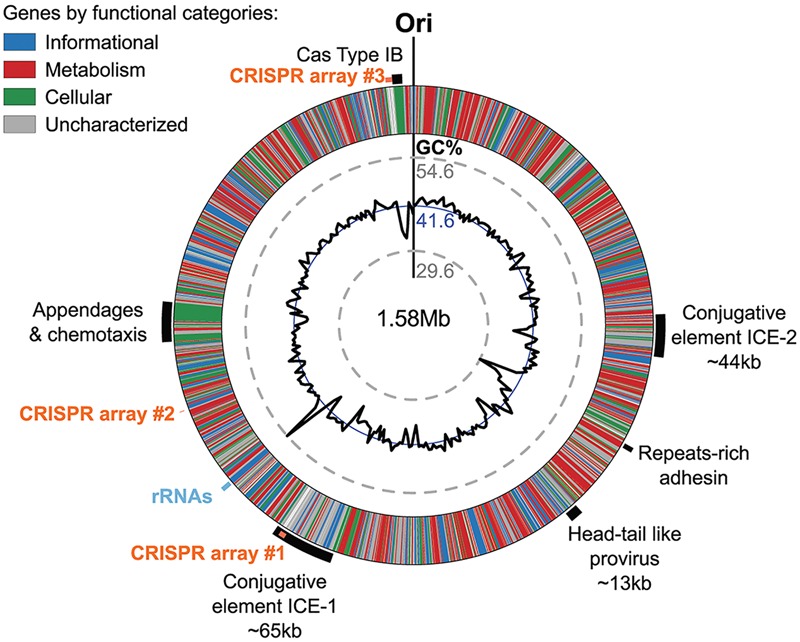
FIGURE 7.

Genomic regions of atypical GC% content contain mobile genetic elements in Ca. N. cavascurensis. The genome is displayed in the form of a ring where genes are colored by functional categories (arCOG and COG), with the mean GC% content (blue circle) and local GC% as computed using 5 kb sliding windows (black graph) in inner rings. The minimal and maximal values of local GC% are displayed as dashed gray concentric rings. The predicted origin of replication is indicated with ”Ori.” Several large regions show a deviation to the average GC% that correspond to mobile genetic elements, i.e., ICEs (integrated conjugated elements), a specific pilus (see Figure 8), and a defense system (CRISPR-Cas Type IB and three CRISPR arrays (see text).
