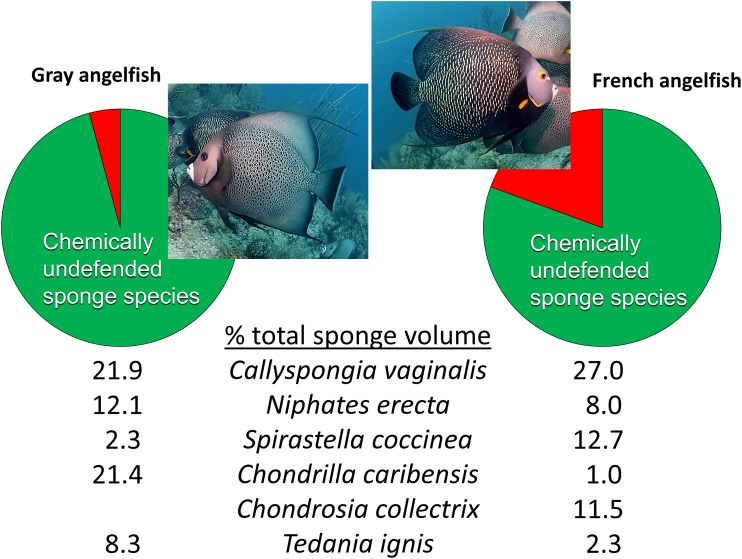
Figure 4. Food preferences of sponge-eating Caribbean angelfishes.
Sponge tissue volume recorded from the guts of Gray and French angelfishes by Randall & Hartman (1968). Pie charts show the total proportion of identifiable sponge species that are in the chemically defended (red) and undefended or palatable (green) categories, based on bioassay data (Loh & Pawlik, 2014). Mean percentage of total sponge volume in the gut made up of the top six sponge species, all of which are in the palatable category, are shown for each fish species. Photographs by J.R. Pawlik.

