Figure 2.
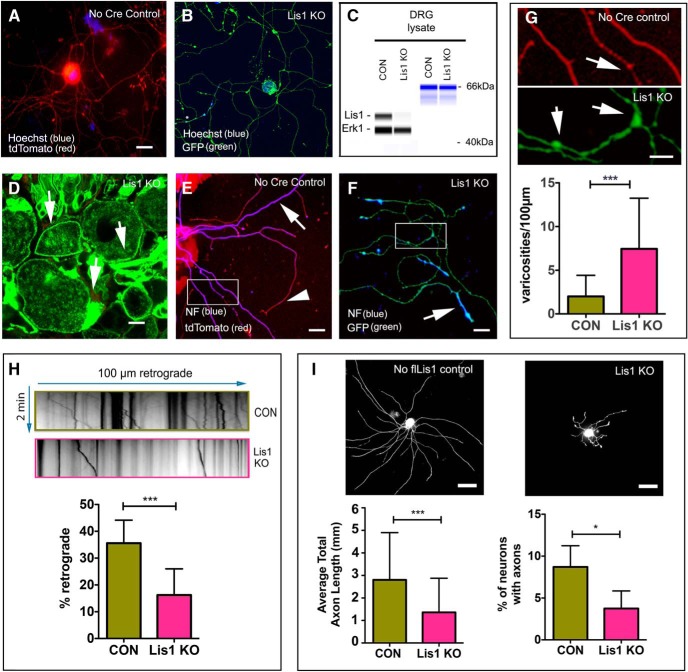
Lis1 KO impacts axonal function in adult mouse DRG neurons. A, Cultured DRG neurons from no Cre control exposed to 4-OH tamoxifen for 5 d expressed only tdTomato (red) showing no signs of recombination. B, In contrast, Lis1 KO neurons had strong GFP expression (green) demonstrating recombination. C, 4-OH tamoxifen reduced Lis1 protein levels in Lis1 KO neurons relative to no Cre control neurons (CON). D, Intraperitoneal injection of 2 × 8 mg tamoxifen in Lis1 KO mice resulted in GFP expression in intact DRGs after 4 d. Arrows point to DRG plasma membranes. E, Cultured DRG neurons prepared from intraperitoneally injected, no Cre control animals expressed only tdTomato (red). NF (blue) was prominent along axon shafts (white arrow) but less prominent in axon terminals (arrowhead). F, DRG neurons prepared from intraperitoneally injected Lis1 KO mice continued to express GFP (green) in culture, and NF (blue) was most prominent in distal axons and enriched in in varicosities (arrow). G, Insets from E, F have been digitally enlarged to show axonal varicosities (arrows). The bar graph in G shows the average number of varicosities per 100 µm of axon from N = 3 CON (45 mm total axon length) and three Lis1 KO (27 mm total axon length) mice. H, Kymographs were generated from time-lapse movies of LysoTracker labeled organelles in GFP-positive axons. The bar graph shows the percentage moving retrogradely in Lis1 KO and no flLis1 control cultures (CON). A total of 27 100 µm axon segments were analyzed from N = 2 CON and N = 2 Lis1 KO mice. A total of n = 521 control and n = 699 KO organelles were analyzed. I, Cultured DRG neurons prepared from intraperitoneally injected, no flLis1 control and Lis1 KO mice were immunostained with neuron-specific antibodies, and the percentage of neurons with growing axons was determined from N = 4 CON and N = 5 Lis1 KO mice. A total of n = 2219 control neurons and n = 2410 Lis1 KO neurons were analyzed. Bars in G-I indicate mean ± SD. Significance determined by Mann–Whitney test (G), Student’s t test (H, I), *p < 0.05, ***p < 0.001 (see Table 2 for details). Scale bars: 20 µm (A, D, E), 5 µm (B), and 50 µm (I).

