Figure 4.
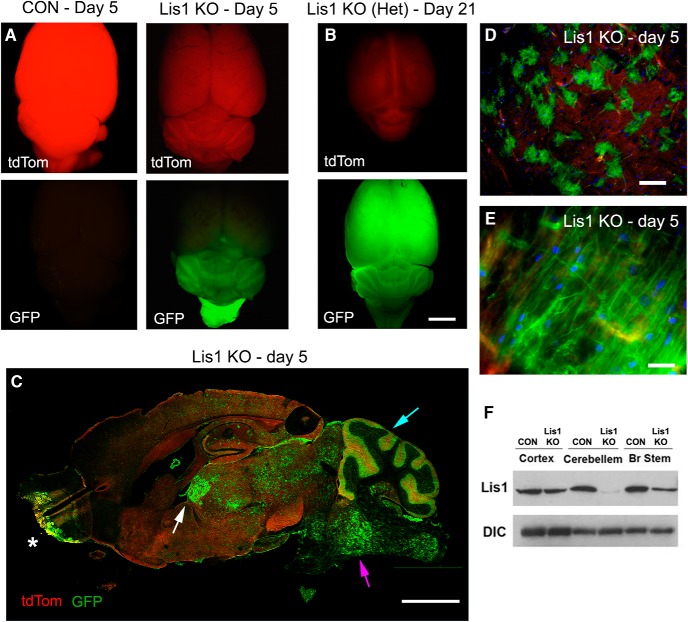
Cre-dependent recombination in the brain after tamoxifen injection. All data in this figure are representative of observations from a minimum of N = 4 animals of each genotype. A, On day 5 after the 2 × 8 mg tamoxifen regimen, no Cre control brains (CON, day 5) had bright dtTomato fluorescence (top left panel), but no GFP fluorescence indicative of recombination (lower left panel). Lis1 KO mice (Lis1 KO, day 5) showed reduced dtTomato fluorescence (top right panel) and expressed EGFP primarily in the hindbrain, indicating that Cre activity was pronounced in this brain region (lower right panel). B, Lis1 KO het mice [Lis1 KO (Het), day 21], which showed no sign of neurologic problems through day 21 after the injection had substantial GFP expression throughout the brain at that time. C, A sagittal section of a Lis1 KO brain on day 5 (Lis1 KO, day 5) shows mosaic recombination in midbrain (white arrow), hindbrain (magenta arrow), and cerebellum (blue arrow), with widely scattered GFP-positive cells in cortex and hippocampus. Recombination also occurs in olfactory bulb (asterisk). D, Using higher magnification, GFP-positive cells in the midbrain can be seen interspersed with cells that have not yet undergone recombination. E, Fibers labeled with GFP are clearly visible in the brainstem. F, Lis1 expression is reduced in extracts from brainstem and cerebellum of Lis1 KO mice compared to no Cre controls. Scale bars: 5 mm (A–C), 100 µm (D), and 20 µm (E).

