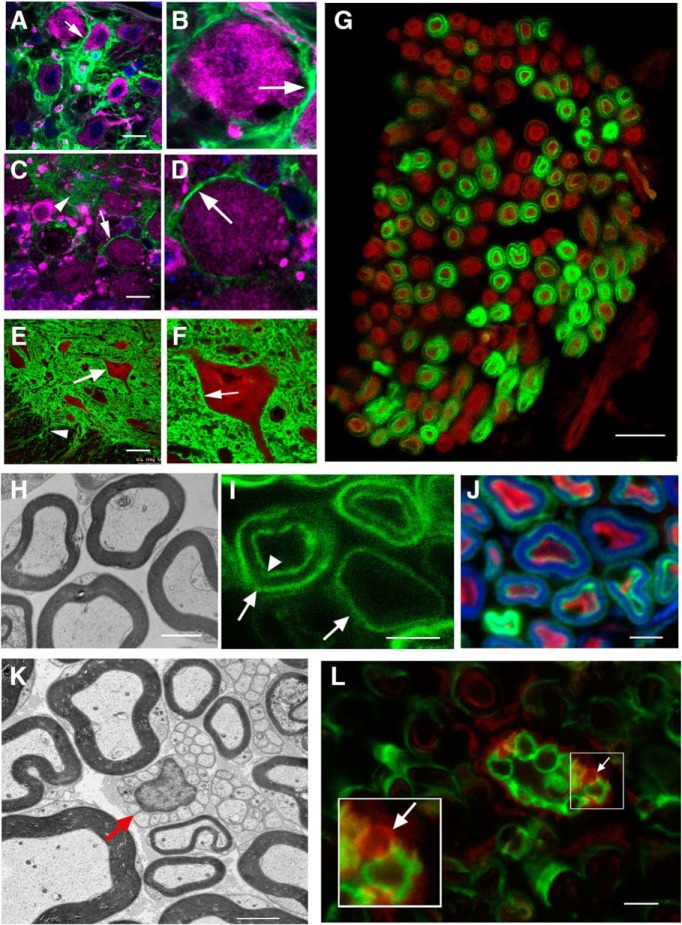
Figure 5.
Both neurons and glia show evidence Cre-dependent recombination. All data in this figure are representative of observations from a minimum of N = 4 animals of each genotype. A, GFP-positive neuropil surrounds MAP2-positive neurons (magenta) in a brainstem region thought to be the nucleus ambiguous in a mouse exposed to the 2 × 8 mg tamoxifen regimen. B, The neuron indicated in A has been digitally enlarged to show details. The arrow points to possible neuronal plasma membrane. C, Purkinje cells in the cerebellum stained with MAP2 (magenta) also have GFP-positive plasma membranes (white arrow) indicating that recombination occurred in these neurons. Neuropil in the molecular layer is also GFP-positive (arrowhead). D, The neuron in C has been digitally enlarged to show detail. E, GFP-positive neuropil surrounds a motor neuron (white arrow) labeled with ChAT (red) in the anterior horn of the thoracic spinal cord. GFP-positive fibers (arrowhead) can be seen coursing toward the ventral root. F, The motor neuron indicated in E is digitally enlarged to show detail. The white arrow points to apparent neuronal plasma membrane. G, A cross section through the phrenic nerve shows concentric rings of GFP around approximately half of the NF-positive axons (red). H, EM of a cross section through a WT mouse nerve showing myelinated axons. I, GFP can be observed as two concentric rings or single rings (arrows, outer ring, arrowhead, inner ring). J, The area between concentric rings is positive for myelin basic protein (blue), while the inside of the inner ring is positive for NF (red). K, EM of a cross section of WT mouse sciatic nerve showing Remak bundles of unmyelinated axons surrounded by a single glial cell (red arrow). L, Cross section of sciatic nerve from Lis1 KO mouse with a Remak bundle containing some GFP-encircled axons, and some without encircling GFP (arrow, positive for tdTomato only). Inset is digitally enlarged to show an axon without recombination (red, arrow) alongside recombined axons (green). Scale bars: 10 µm (A, C, G), 30 µm (E), and 2 µm (H–L).

