Figure 6.
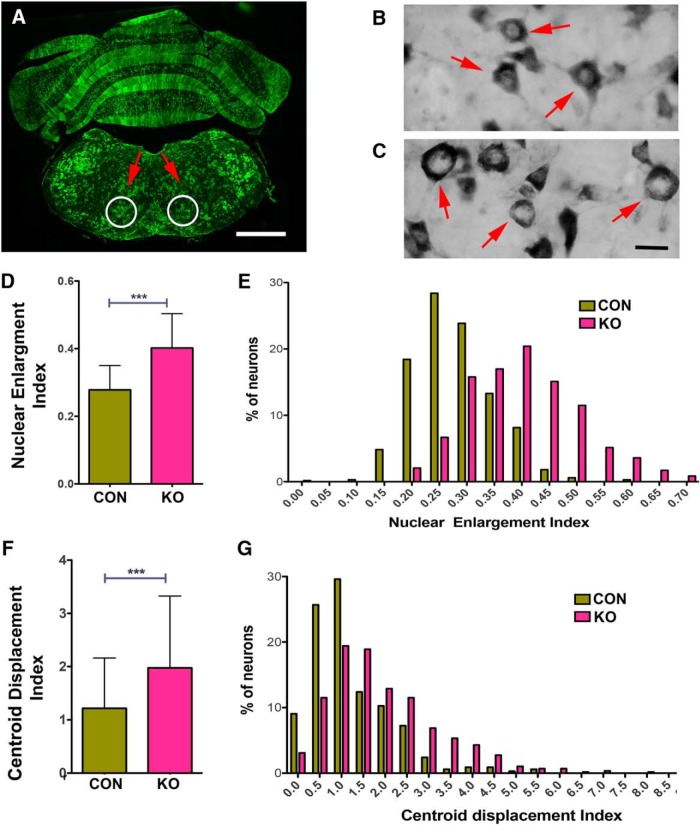
Brainstem neurons in Lis1 KO mice exhibit signs of chromatolysis. A, A coronal section through the hindbrain on day 4 after the 2 × 8 mg tamoxifen regimen shows extensive recombination in the ventral brainstem containing cardiorespiratory centers. White circles indicate the region used in the analyses of chromatolysis. B, C, Sections were stained with toluidine blue to determine the size and position of the nucleus in neurons in the indicated regions. The neurons in B are from a no flLis1 control mouse. The neurons in C are from a Lis1 KO animal. D, A nuclear enlargement index (see Materials and Methods) was used to compare nuclear enlargement in no flLis1 controls (CON) and Lis1 KO (KO). E, The histogram shows the distribution of this index in CON and Lis1 KO neurons. F, The position of the nucleus within the soma was also determined using the centroid displacement index (see Materials and Methods). This involves determining the centroid position of both the nucleus and soma and calculating the total displacement distance (µm) of the nuclear centroid from the somal centroid. G, Histogram showing the distribution of CDI found in CON and KO neurons. Bars indicate mean ± SD. Brainstem sections from three no flLis1 control and four Lis1 KO mice were used in the chromatolysis study. This includes analysis of 331 control neurons and 583 Lis1 KO neurons. Significance determined by Student’s t test (D), or Mann–Whitney test (F); ***p < 0.001 (see Table 2 for details). Scale bars: 1 mm (A) and 10 µm (B, C).

