
Figure 7.
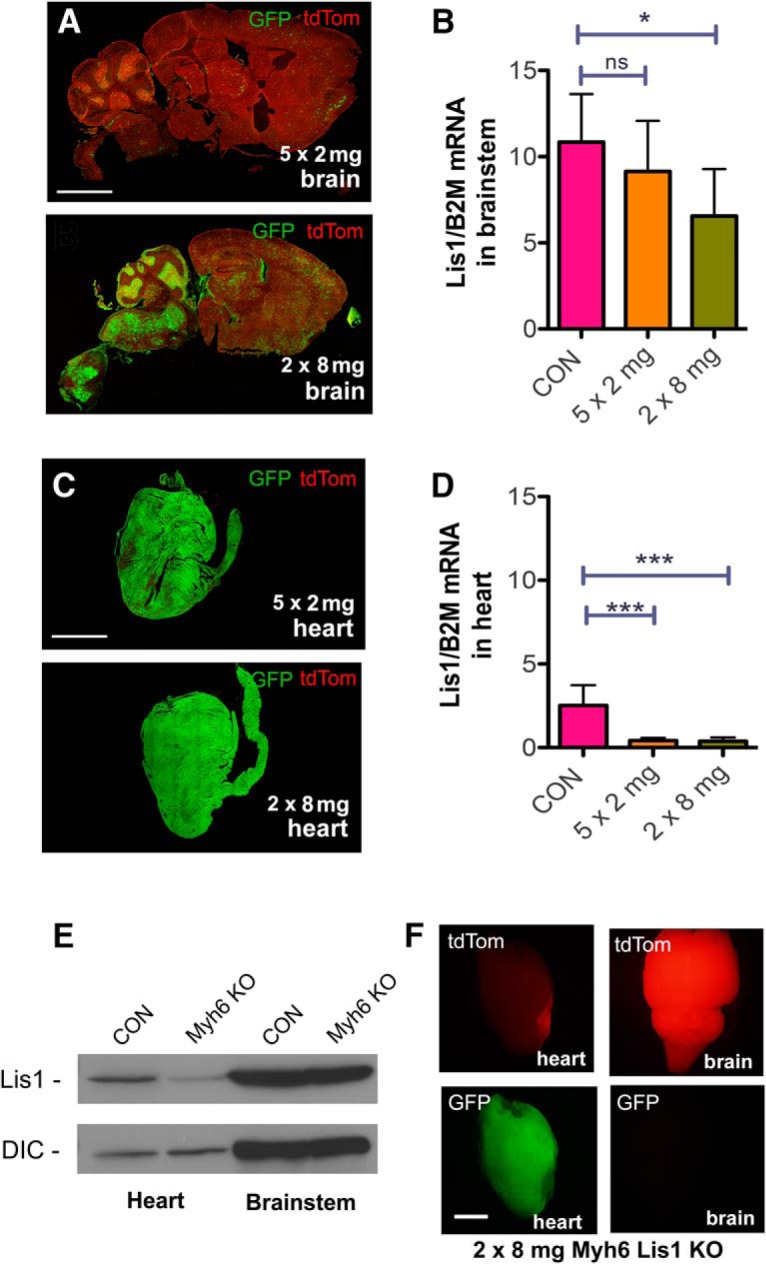
Comparing the effect of Lis1 KO in brainstem and heart. A, Sagittal brain sections of Lis1 KO mice 5 d after the initial injection of either five injections of 2 mg tamoxifen (top) or two injections of 8 mg tamoxifen (bottom). The 2 × 8 mg treatment resulted in much higher GFP expression than the 5 × 2 mg treatment, particularly in the brainstem and cerebellum. B, Lis1 mRNA levels normalized to B2M mRNA levels from brainstem of no Cre control mice injected with 2 × 8 mg tamoxifen (CON), and Lis1 KO mice injected with either 5 × 2 or 2 × 8 mg tamoxifen. Lis1 mRNA levels were significantly decreased in brainstem of 2 × 8 mg animals, but not 5 × 2 mg animals, relative to no Cre controls, 5 d after initial injection. C, Sections of heart from 5 × 2 mg (top)- and 2 × 8 mg (bottom)-treated Lis1 KO mice. Both the 2 × 8 and 5 × 2 mg treatments resulted in similar levels of GFP expression in heart. D, Lis1 mRNA levels normalized to B2M mRNA levels from heart of 2 × 8 mg-injected no Cre control (CON)-, 5 × 2 mg-, and 2 × 8 mg-treated mice. Lis1 mRNA levels were reduced significantly in both the 5 × 2 mg- and 2 × 8 mg-treated mice relative to the no Cre control but were not significantly different from each other. E, Western blotting of brainstem and heart lysates from cardiomyocyte-specific Myh6 KO mice show reduced levels of Lis1 protein in heart, but not brainstem compared to no Cre control mice (CON). Dynein intermediate chain (DIC) was used as a loading control. F, Whole mount brain (right) and heart (left) from Myh6 KO mouse show recombination (GFP) in heart but not brain. Data in A, C, E, F are representative images from N = 3 mice for each genotype. The RNA quantification in B, D represent mean of data from N = 3 animals of each treatment and genotype ± SD. Significance in B, D determined by one-way ANOVA; *p < 0.05, ***p < 0.001 (see Table 2 for details). Scale bars: 5 mm (A, C) and 2 mm (F).