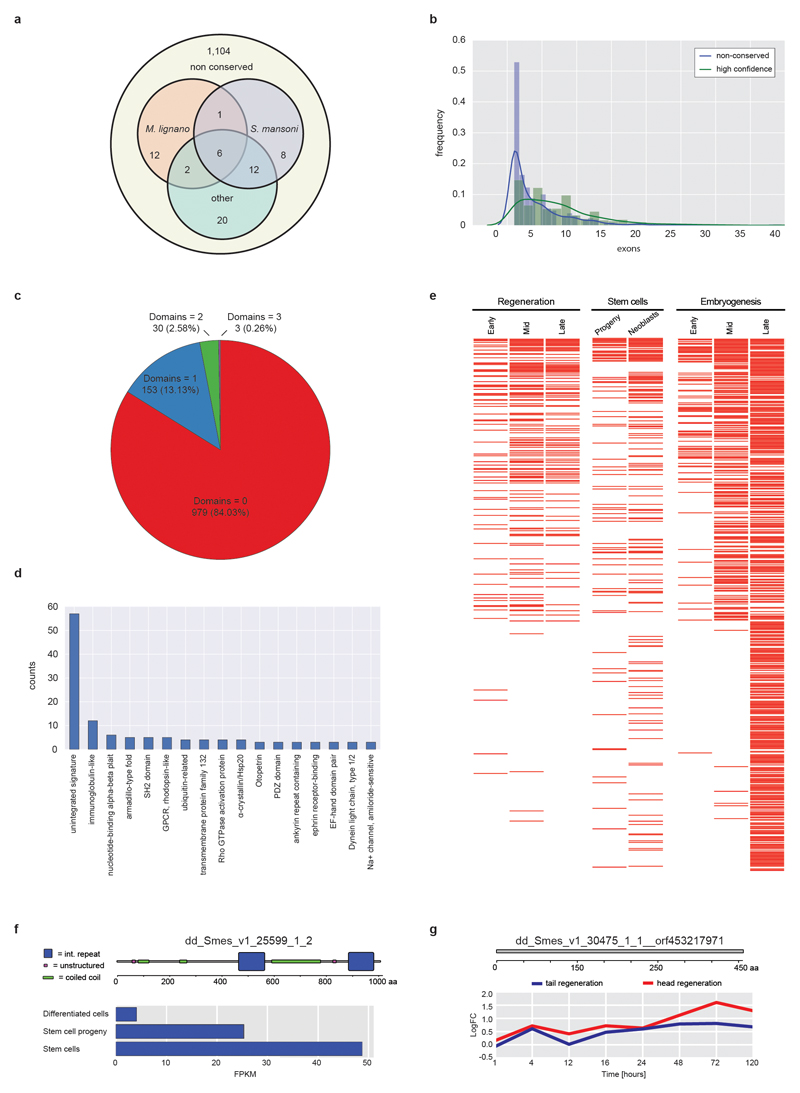
Extended Data Figure 6. Planarian-specific genes.
a) Conservation of 1,165 flatworm-specific genes (Supplementary Information S16.1) amongst flatworm species. Only 61 sequences had sequence homologues in the indicated flatworm species (Other = T. solium, E. multilocularis, E. granulosus, H. microstoma), indicating that this gene set mostly represents planarian-specific genes. b) and c) characteristics of planarian-specific genes. b) Distribution of exon numbers compared to a control gene set (HC-cDNAs; Extended Data Fig. 2a), indicating an enrichment of single exon genes. c) Number of predicted domains (InterProScan), indicating that only a minority contains predicted domains. d) Identity of detected domains (Pfam and SUPERFAMILY). “unintegrated signatures” designates recurring sequence motifs that are not grouped into InterPro entries. These might represent so far un-curated or weakly supported motifs that do not pass InterPro's integration standards. e) Differential expression of 626 planarian-specific genes in published Smed RNAseq data sets of different regeneration phases (left), stem cells or progeny populations (middle) or specific developmental stages (right). Red lines indicate differential expression relative to the control of each series (white = no change). Genes were ordered using rank by sum. The high proportion of differential expression indicates the widespread contribution of lineage-specific genes to planarian biology. f) and g) Specific examples of non-conserved genes. Top: SMART domain representation. Bottom: Differential expression under the indicated conditions.

