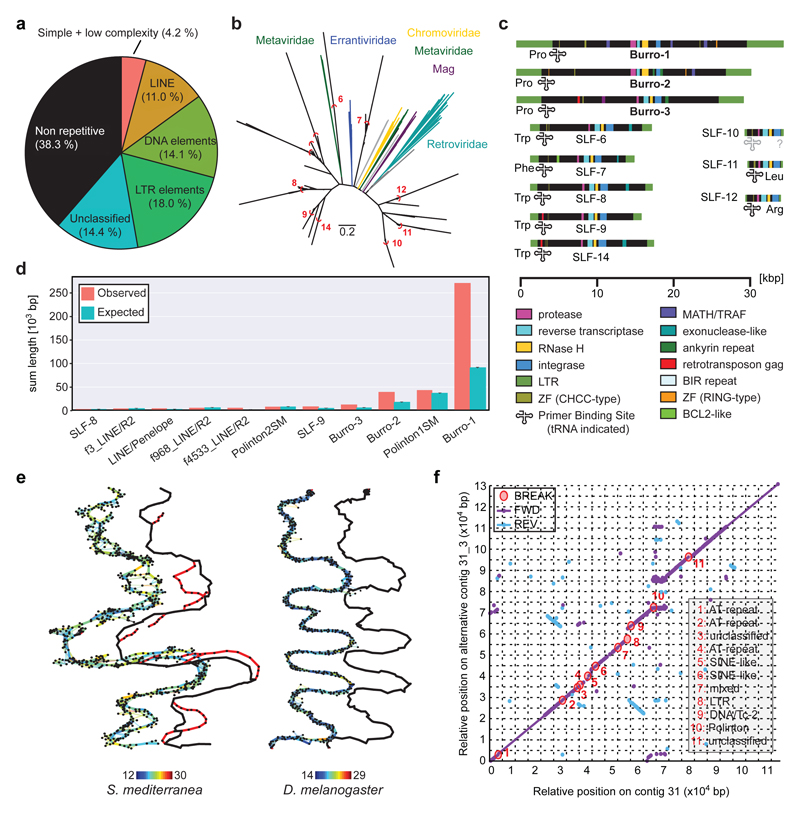
Figure 2. Smed Assembly challenges.
a) Repeat content of the assembly. b) Long Terminal Repeat (LTR) family phylogeny. Known LTR families are shown in colour, Smed LTR families in black. Red arcs delimit clusters for consensus calculation. Scale bar: 0.2 substitutions/site. c) Domain annotation of the 11 Smed LTR families. SLF: Smed LTR Family. d) Enrichment analysis of indicated repeat elements within the terminal 1,000 bp of all scaffolds (n = 962). “Expected” represent mean repeat frequency with 95% bootstrap CI (n = 1,000). e) Graphical representation of representative ~1.6 Mbp and ~1.7 Mbp segments of Smed (left) and D. melanogaster (right) MARVEL PacBio assembly graph segments. Thick lines: Consensus sequence; thin lines: individual read alignments; Colour-coding: alignment quality (blue: low, red: high); black marks: repeats. The contig tour of the final haploid genome assembly is shown offset to the right, alternative regions are shown in red. f) Dot plot comparison between a representative alternative region and the corresponding main contig. Fwd: Forward match. Rev: Reverse match. Break: insertions/deletions > 99 bp. Break annotations (right) list repeat categories that cover > 60% of the insertion/deletion sequence, “mixed” indicates contributions of multiple repeat classes.

