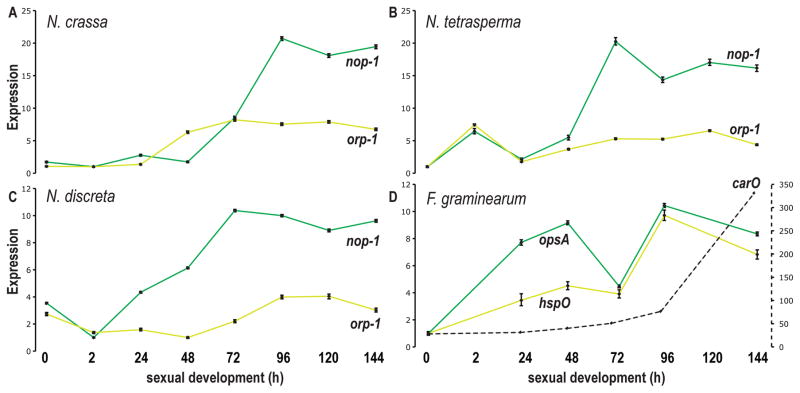
Figure 4.
Expression of fungal opsins across perithecial development from 0 h (protoperithecia) to 144 h (mature perithecia). Expression was measured for A) N. crassa nop-1 (green) and orp-1 (yellow), B) their orthologs in Neurospora tetrasperma, C) their orthologs in Neurospora discreta, and D) their orthologs opsA and hspO and paralog carO (black, dashed) in F. graminearum. The right-hand Y-axis indicates gene expression levels for carO, whose expression changes across sexual development much more than does opsA and hspO.

