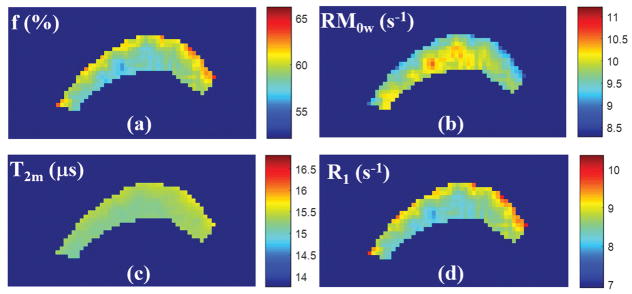
Figure 2.
Color mapping of MT modeling parameters from an ex vivo bovine cortical bone specimen, including macromolecular fraction (f) (a), proton exchange rate from the macromolecular to water pools (RM0w) (b), T2 relaxation time of the macromolecular pool (T2m) (c), and spin-lattice relaxation rate of the water pool (R1w) (d). Color maps demonstrate good homogeneity of MT modeling values within cortical bone. Color bar indicates the gradation of MT modeling measures.

