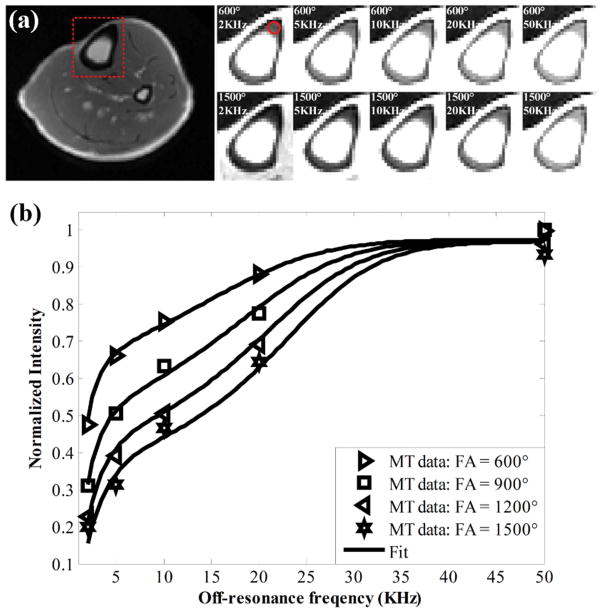
Figure 3.
(a) Representative MT images from in vivo human tibial cortical bone obtained with MT flip angles of 600° and 900° at increasing off-resonance frequencies of 2, 5, 10, 20, and 50 kHz. (b) Fitting curves for cortical bone signal intensity versus off-resonance frequency for multiple MT flip angles are shown. Similar to bovine cortical bone, increased signal intensity is evident at low MT flip angles and high off-resonance frequencies. Red dashed box in far-left image (a) shows field of view selection for MT analysis. Red circle in top left MT image (600°, 2 kHz) (a) shows region of interest used for signal intensity measurement.

