
Figure 1.
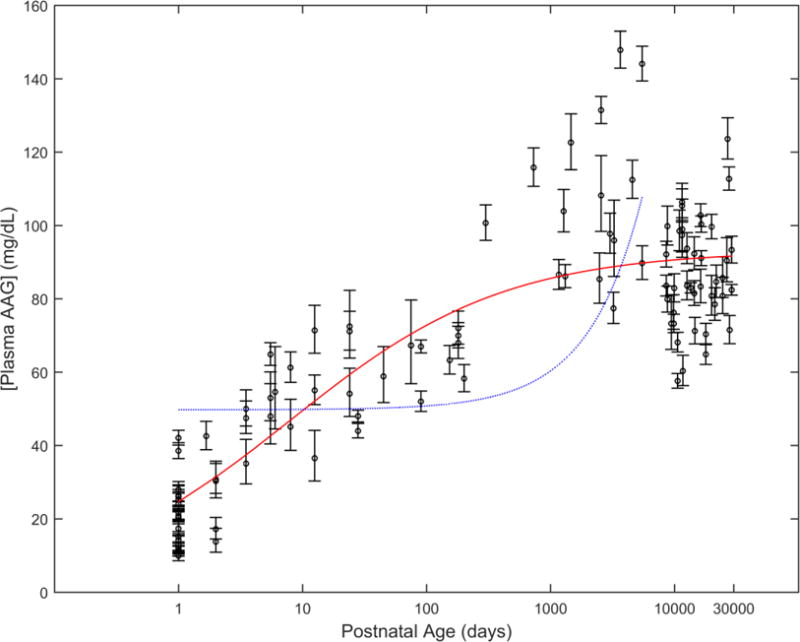
Ontogeny of AAG among healthy subjects. Concentrations, normalized to CRM470 values, are depicted using estimated geometric mean values (o) for each study group. Geometric error bars depict the log-normal SE associated with each study cohort. Predicted AAG concentrations based on a sigmoid Emax model (solid line - red), as derived from this work, and a linear model (dashed line - blue), as proposed by McNamara and Alcorn (assuming adult plasma AAG concentrations ≈ 93.17 mg/dL) [2], are denoted. Observed data were compiled from the following publications: [13, 18, 20, 21, 23, 29–49].