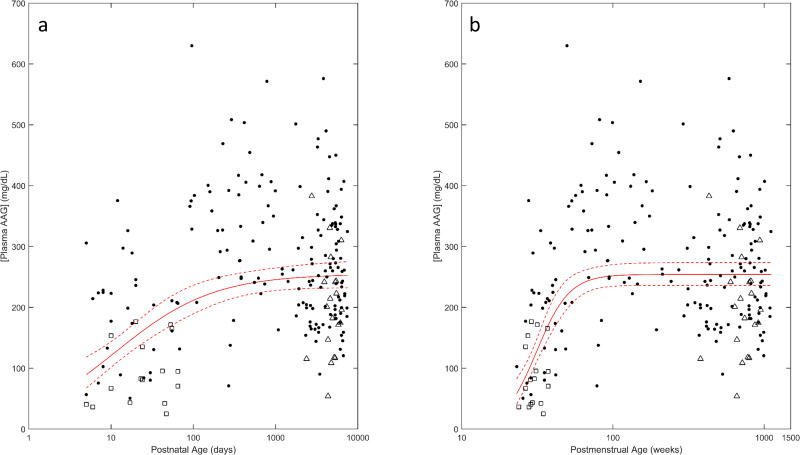
Figure 2.
AAG ontogeny with respect to (A) PNA and (B) PMA in subjects diagnosed or suspected of infection. Median (i.e. geometric mean) AAG concentrations (solid lines) and associated 95% CI (dashed lines) as estimated using a sigmoid Emax model are depicted. Subjects from the each clinical trial (Staph Trio, □; PTN POPS ●;CLIN01 Δ) are denoted separately.

