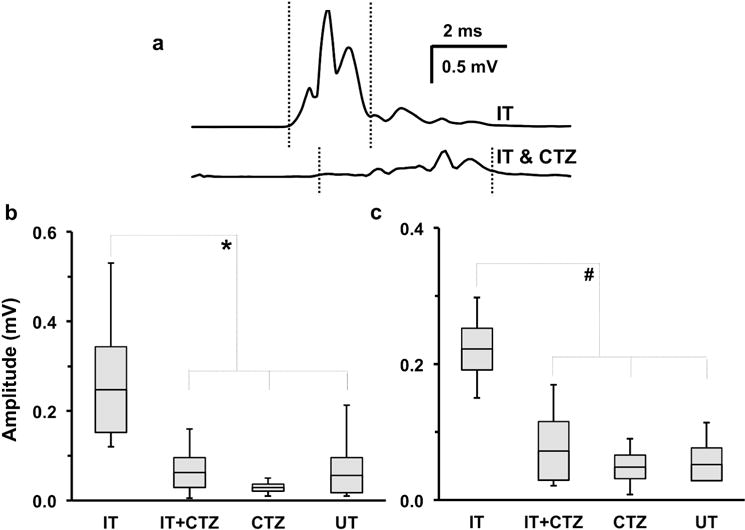
Figure 3.

Recovery of electrically evoked maximum direct muscle M responses recorded three weeks after sciatic nerve transection and repair. (a) Representative traces recorded from lateral gastrocnemius (LG) in interval-trained mice that were either untreated (IT) or treated with h-CTZ prior to each exercise session (IT+CTZ). Vertical dotted lines indicate time window of the M response used for amplitude measurements. (b, c) In these bar-and-whisker plots, the size of the bars indicate the mean ± SEM, the horizontal line in the center of the bar represents the mean, and whiskers are used to indicate the range of values in each data set. The amplitude of M-max responses in the IT group was significantly greater than that of the IT+CTZ group (b: LG, *p=0.026; c: tibialis anterior (TA), #p=0.0005), as well as mice treated with h-CTZ (CTZ) (b: LG, *p=0.008; c: TA, #p=0.0001) and untreated mice (UT) (b: LG, *p=0.017; c: TA, #p=0.0003) groups.
