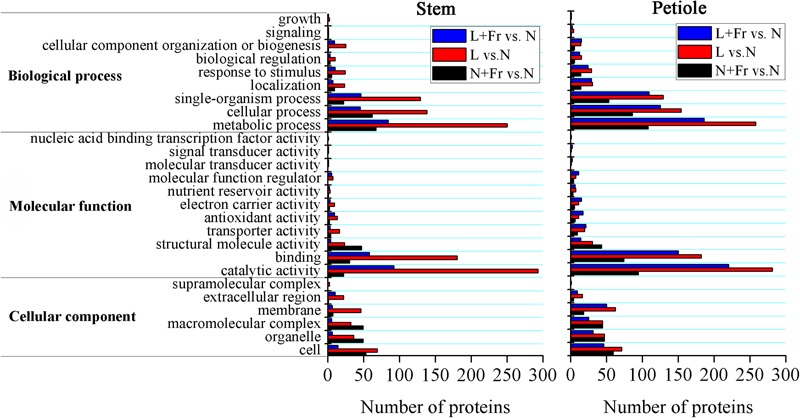
FIGURE 7.

Differential protein expression analyses of soybean stem and petiole in different treatments. N, N+Fr, L, and L+Fr denote normal light (normal PAR and normal R/Fr ratio), normal light plus far-red light (normal PAR and low R/Fr ratio), low light (low PAR and normal R/Fr ratio), and low light plus far-red light (low PAR and low R/Fr ratio), respectively.
