Figure 2.
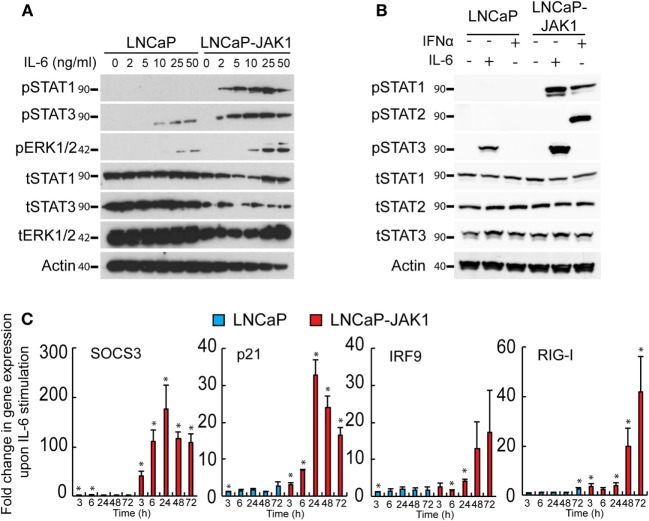
JAK1 expression alters IL-6 signaling in LNCaP-JAK1 cells. (A) Immunoblot analysis of STAT1, STAT3, and ERK1/2 phosphorylation. LNCaP and LNCaP-JAK1 cells were exposed to the indicated concentrations of IL-6 for 20 min and processed for immunoblotting. (B) Immunoblot analysis of STAT1, STAT2, and STAT3 phosphorylation. LNCaP and LNCaP-JAK1 cells were exposed to IL-6 (5 ng/mL, 20 min) or IFNα (200 U/mL, 20 min) and processed for immunoblotting. (C) Transcriptional response of LNCaP and LNCaP-JAK1 to IL-6 stimuli. Cells were incubated with IL-6 (5 ng/mL) for the indicated time periods and mRNA levels of the indicated genes were quantified by qRT-PCR. Graph depicts mean ± SE (n = 3) of fold change in mRNA levels upon IL-6 stimuli, normalized to GAPDH expression, in LNCaP or LNCaP-JAK1 cells. *p < 0.05, relative to expression at t = 0.

