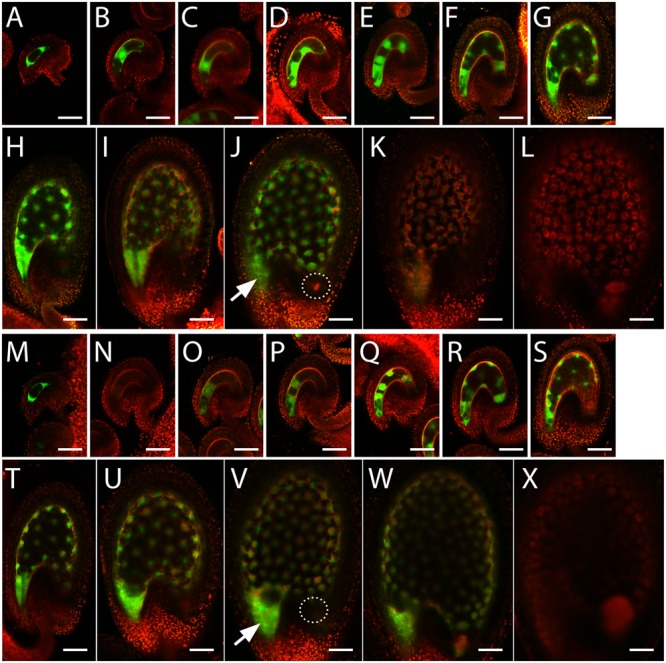
FIGURE 3.

InvINH1 and InvINH2 promoter activity in the female gametophyte and the endosperm. Promoter-GFP fusions for InvINH1 (A–L) and InvINH2 (M–X) were analyzed by confocal microscopy in the ovules isolated from stage 12 flowers (Smyth et al., 1990) containing stage FG4 (Christensen et al., 1997) female gametophyte (A,M) and from flowers at 1 day after emasculation (B,N). The GFP signals in the fertilized seeds were analyzed at endosperm stage I (C,O), II (D,P), III (E,Q), IV (F,R), V (G,S), VI (H,T), VII (I,U), VIII (J,V), and IX (K,W) (Boisnard-Lorig et al., 2001), as well as in seeds containing heart stage embryos (L,X). The embryo stage in (L,X) was verified by dissection. GFP (green) and auto-fluorescent signals (red) were imaged simultaneously and merged. All the images were oriented with the micropylar ends on the left and the chalazal ends on the right. Arrow indicates micropylar endosperm. Dashed circle indicates the location of chalazal endosperm. Bar = 50 μm.
