
FIGURE 5.
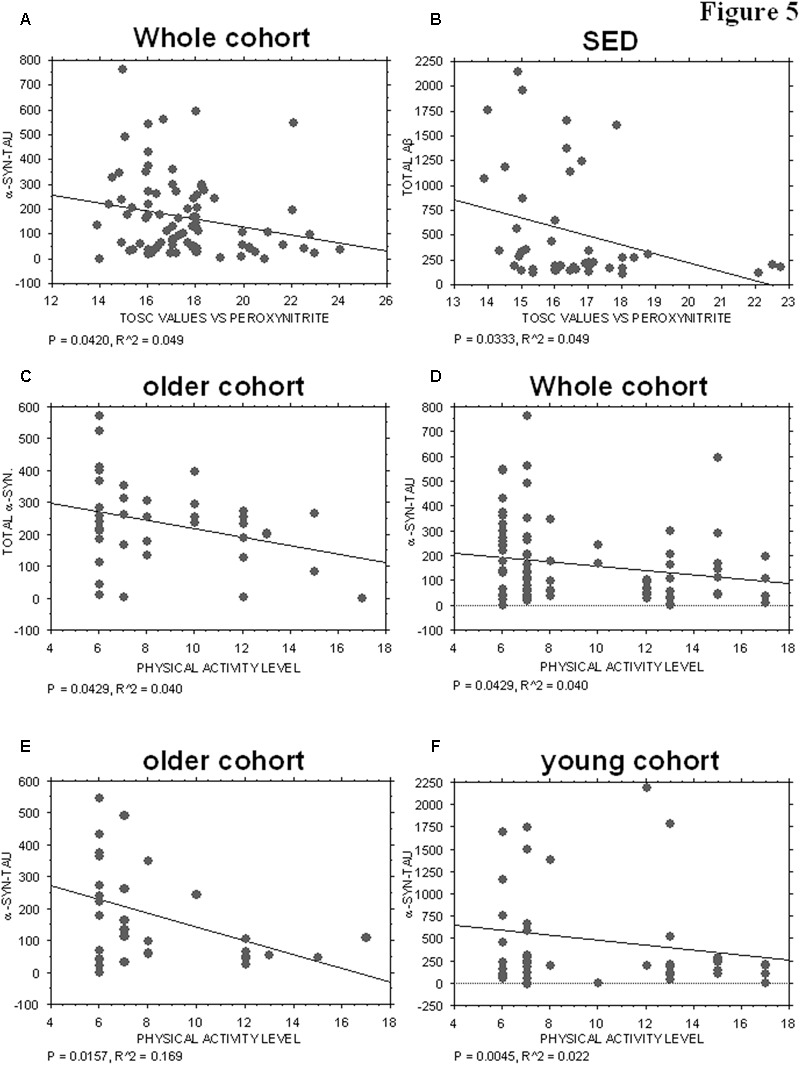
Correlation between ND-related proteins and TOSC values against peroxynitrite derivatives or physical activity level. (A) Correlation analysis between α-syn/tau concentrations in platelets and TOSC values against peroxynitrite derivatives in the total cohort. (B) Correlation analysis between Aβ concentrations in platelets and TOSC values against peroxynitrite derivatives in SED cohort. (C) Correlation analysis between total α-syn concentrations in platelets and physical activity level in older cohort. (D–F) Correlation analysis between α-syn/tau concentrations in platelets and physical activity level in total (D), older (E) and young (F) cohort. Correlation between variables was determined by simple linear regression analysis, using the StatView program (Abacus Concepts, Inc., SAS Institute, Cary, NC, United States). P and R2 values obtained for each correlation are reported in the respective panel.