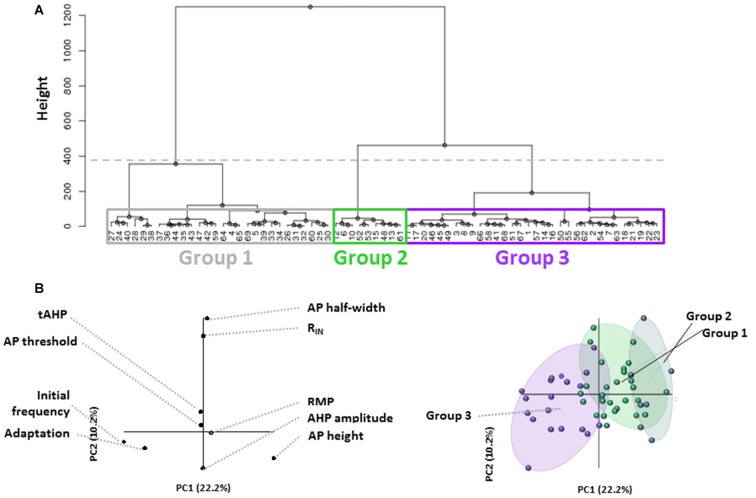
Figure 1.
Unbiased identification of physiological distinct layer 1 (L1) interneuron (IN) populations. (A) Dendrogram generated from hierarchical cluster analysis of electrophysiological properties of L1 cells. The dashed horizontal line indicates the cutoff for heterogeneous groups based on the exponential decay in the Euclidean distance between consecutive branch points. Boxes indicate the three groups identified. Colors correspond to Panel (B) right. Each terminal branch represents a recorded L1 IN, each indicated by a number. (B) Partial least squares enhanced discrimination analysis (PLS-EDA) was used to ascertain the defining properties for identified groups. The contribution of assessed properties to each principal component (PC) is illustrated in the graph to the left. Correlation of individual cells plotted on the same axes (right graph) reveals that initial firing frequency and frequency adaptation most strongly identify Group 3, with Groups 1 and 2 being distributed along the same PC axis.

