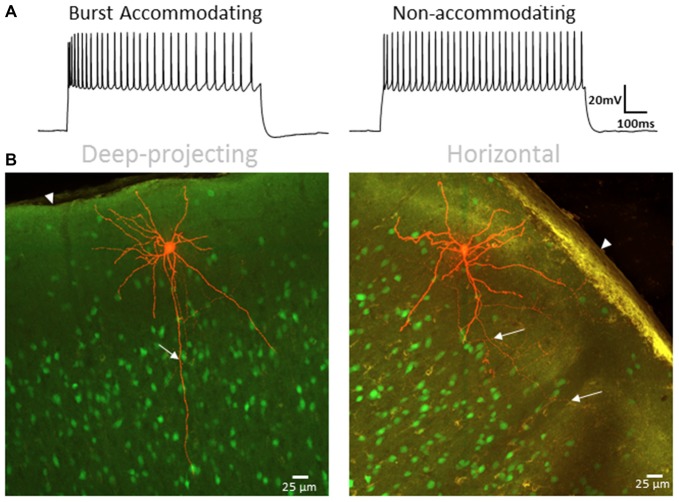
Figure 11.
L1 IN physiology correlates with morphology. (A) Specimen records showing BA (left) and NA (right) firing patterns used for correlation with axonal projection type. (B) Representative images of a deep-projecting (left) and horizontally-confined (right) L1 INs. Labeled cells are shown in red with other VGAT-positive cells shown in green. White arrows indicate axonal projections whereas arrowheads indicate the pial surface. A significant correlation between type of axon projection and physiology was identified (χ2: p < 0.01), with a distinct deep projecting axon being identified in a larger percentage of BA cells (BA = 11 of 14, NA = 1 of 8), while a greater portion of NA cells were identified as horizontally projecting (BA = 1 of 14, NA = 3 of 8). Scale bar = 25 μm.

