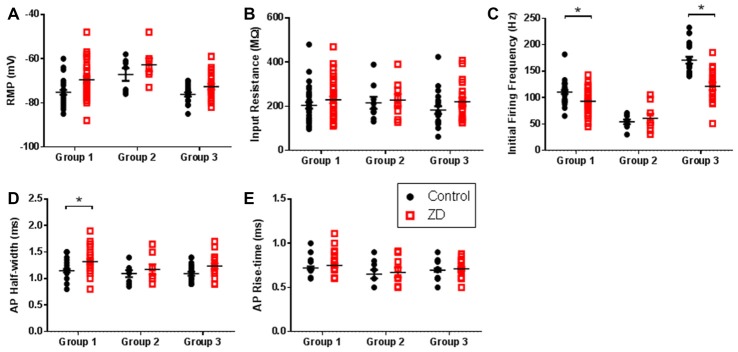
Figure 3.
HCN channel inhibition exerts cell-type specific effects on intrinsic excitability. Scatter plots showing (A) the resting membrane potential (RMP), (B) input resistance (RIN), (C) initial firing frequency, (D) action potential (AP) half-width and (E) AP rise time of cells in each group before (black circles) and after (red squares) wash-on of the HCN channel antagonist ZD7288. Group 1 showed the largest effects whereas Group 2 cells displayed no modulation of intrinsic excitability by HCN channels. *p < 0.05, paired t-test. Each shape represents an individual cell. Error bars are mean ± SEM.

