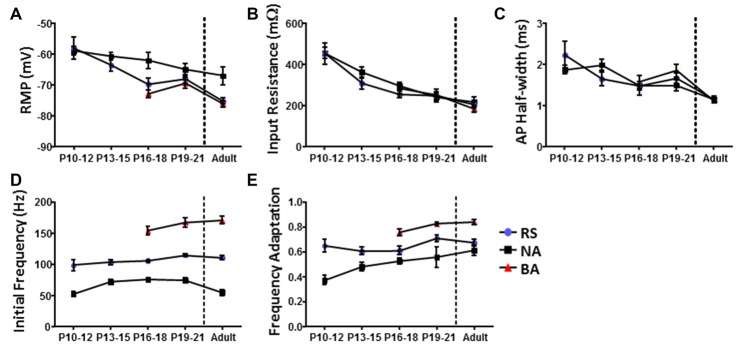
Figure 6.
Identified L1 IN groups display distinct intrinsic properties throughout development. Graphs illustrating differences in the (A) RMP, (B) RIN, (C) AP half-width, (D) initial firing frequency and (E) frequency adaptation of cells in each group as a function of development. Comparison of intrinsic properties across groups suggests a specific distinction between non-accommodating (NA) cells and the other groups. Error bars are mean ± SEM.

