Figure 7.

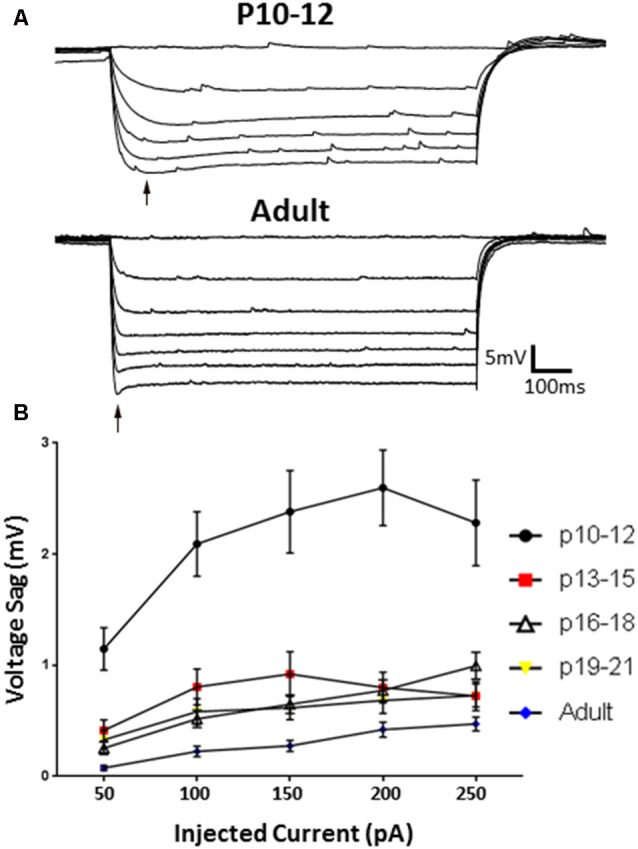
HCN channel-mediated sag responses change with development. (A) Example traces of the sag responses from a P10–12 IN (top) and adult (bottom) animals. (B) The Ih-associated voltage sag is significantly larger at P10–12, and significantly smaller in adult cells, indicating developmental regulation of HCN-mediated effects. Black arrow indicates sag. Error bars are mean ± SEM.
