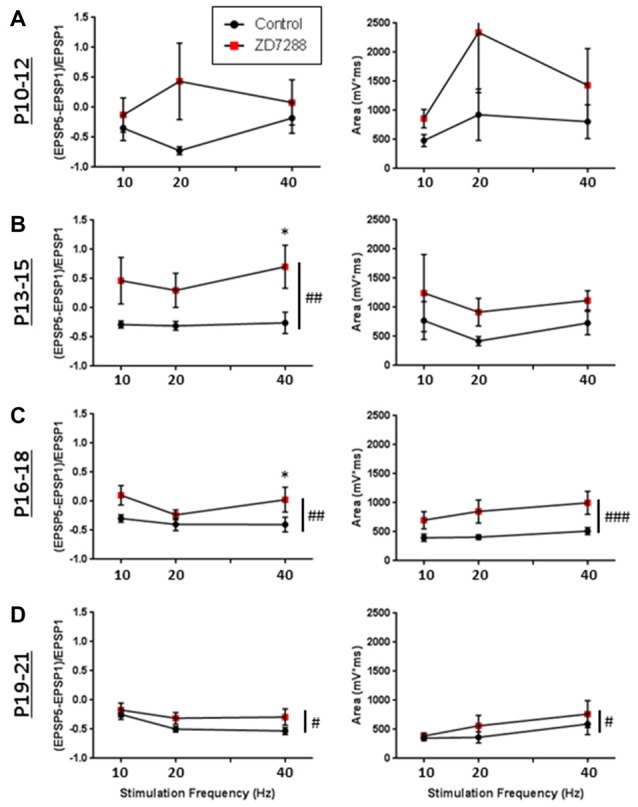
Figure 9.

Developmental modulation of synaptic integration by HCN channels. (A) Graphs quantifying the effects of HCN channel blockade (red squares) on EPSP summation (left) and the total AUC of evoked EPSPs (right) in RS Group 1 cells recorded at p10–12. (B–D) Same as in (A), but for cells recorded at p13–15 (B), p16–18 (C), and p19–21 (D), showing that in RS cells, modulation by HCN channels increases developmentally. #p < 0.05, ##p < 0.01, ###p < 0.001, 2-way ANOVA. *p < 0.05, Dunn-Sidak’s post-test. Error bars are mean ± SEM.
