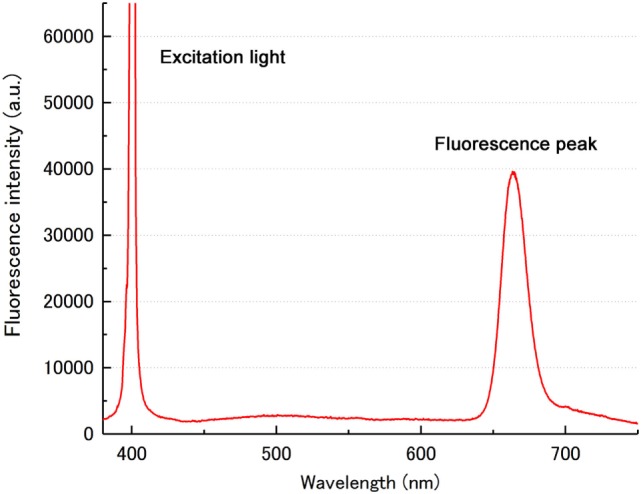
Figure 2.

An example of a fluorescence spectrum from the CE region. A single sharp peak at 664 nm indicated the fluorescence from TS. Another peak corresponding to the 400-nm excitation light was easily distinguished from the TS peak. a.u., arbitrary units; CE, contrast-enhanced; TS, talaporfin sodium.
