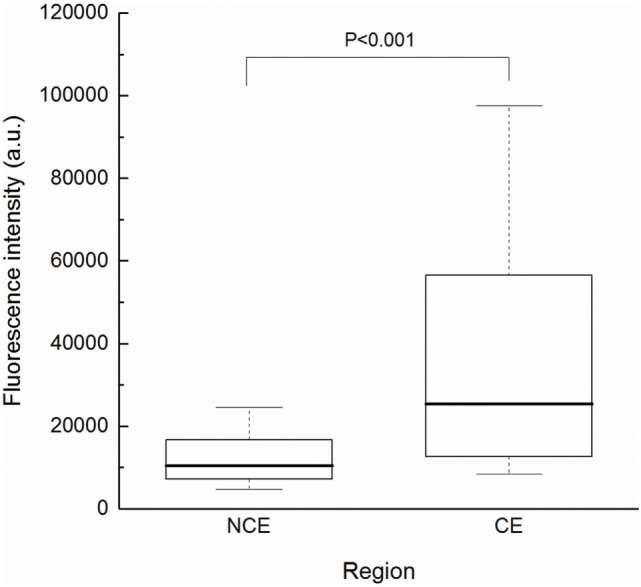
Figure 3.

Fluorescence intensity according to tissue region. The CE group (n = 41) showed significantly higher intensity than the NCE group (n = 45) by Mann–Whitney U test (P < 0.001). Each box indicated the interquartile range, and the median was shown with a bold line. The ends of the whiskers represented the 10th and the 90th percentile. a.u., arbitrary units; CE, contrast-enhanced; NCE, non-contrast-enhanced.
