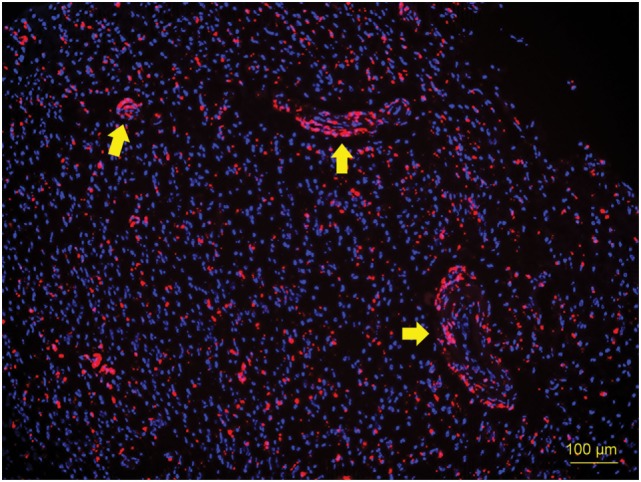
Figure 4.

Fluorescence microscopy image of a 10-µm cryosection of the CE region. Tumor cell nuclei were stained with DAPI. Red fluorescence above 600 nm was observed in the cytoplasm of each tumor cell (excitation wavelength 390–410 nm), indicating that TS was incorporated into the tumor cells. Fluorescence was notably distinguishable along vascular endothelium (arrows). CE, contrast-enhanced; TS, talaporfin sodium.
